- About us
- Contact us: +1.641.472.4480, hfi@humanfactors.com
Cool stuff and UX resources

New Techniques: How to Talk Truthfully About Usability Testing
Introduction
Is it possible to simply "be too smart"? I paged through a book once on how to teach genius kids – got it at a garage sale.
The most disappointing phrase I found was that "there's a limit to how smart a leader can be."
What? Explain THAT please!
Well, to make you all feel better, here's a nice quote from an award-winning researcher, Dean Keith Simonton.
The relationship between IQ and persuasive influence over other members of one's group may drop off beyond an IQ of approximately 120. Individuals who are very smart may be less comprehensible to other group members, and this might have a negative impact on their ability to influence those around them....
As evidence, Simonton's historiometric research demonstrates that more intelligent individuals have had a harder time getting elected to the American presidency! (Simonton, 1999a)

Are you just too smart to sell usability?
No doubt, you have been wondering why it's been a challenge to sell usability services to your colleagues. Well, now you have an answer. Maybe you are simply too smart.
Remember, if you have an IQ over 120, you have a communication problem.
Now that I have your attention, you can appreciate hearing about major advances that have recently occurred in explaining usability testing results.
We have people like usability statisticians James Lewis and Jeff Sauro to thank for their breakthrough efforts in creating simple, down-to-earth phrases for explaining your usability testing results.
Even better, their quest for simplicity offers a better grasp of the truth behind your usability testing results.
Now you have tools to clearly explain your usability test results. Are you tired of saying "we found 85% of the problems with 5 users." (In fact, that's probably wrong.)
The new "talk the talk" lets you mitigate risk, quantify your progress, and justify your work in usability.
Since you have an IQ over 120, I have no fear about using words like "mitigate" or "quantify" or "usability".
Let's see how Jeff Sauro and James Lewis have opened the door to down-to-earth talk about truth in testing.
The old way of talking about usability testing
I get to complain about my own former attempts at explaining usability testing results. (Yes, I am that objective. J ) I flunked in my mission.
Check out my article When Discount Usability Misleads Management – A Solution originally published in the HFI UI Design Newsletter on Jun/July, 2005. I advocated that you should clearly explain that your "pass rates" on testing include the "margin of error".
Here's the classic picture, for which you would notice that a pass rate of 8 out of 10 participants must include mention of that "95% confidence interval". This means that if you repeated the test protocol 100 times, then the pass rate will fall between the bottom and the top margins of error in 95% of those occasions.
I even showed you a neat calculator recently created by Jeff Sauro on his great web site www.measuringusability.com. It calculated a special version of the confidence interval that handled small numbers of subjects. Here's what I told you:
Use the Adjusted Wald results because they take into account the small number of subjects (under 150). Note the lower bound is now 48.29% (48%) instead of 55%. The upper bound is now 95.62% (96%) instead of 105%.
Yikes, I flunked the IQ test!
Clearly, in my enthusiasm for making clear that discount usability testing is a true "crap shoot" (like playing craps at a gambling casino), I missed the boat on straight-talk.
So, now I make amends, dear reader.
I humbly pass on to you a better, clearer method of communicating our usability test results.
"Confidence Intervals" are dead.
"Margins of Error" are gone.
They are dead and gone from our client-communications, that is.
Meanwhile, keep them in mind when using the following instructions.
Clearing the decks for straight talk
IFirst, let's return to "first principles". I take you to that rock of usability, the picture where you may have first thought that "I can do this job".
Recall Jakob Nielsen's famous article "Why You Only Need to Test With 5 Users" published in 19 March of 2000 (as drawn from his 1993 article "A mathematical model of the finding of usability problems").
On the positive side, note that Nielson avoids talking about "pass rates". Instead, he focuses on "finding problems".
That's reasonable, since the pass rates have such a ridiculously wide margin of error (yes, there was some value in my previous article – we learned to pretty much avoid talking about "pass rates".)
So, let's talk about "finding problems".
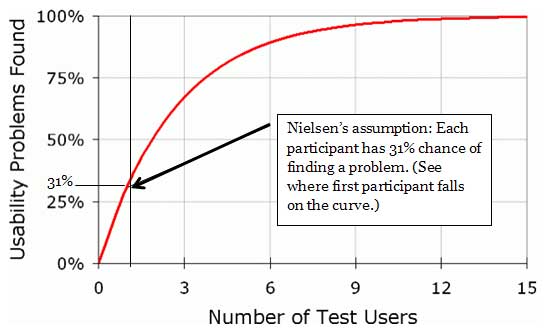
What Nielsen showed us was that each additional testing participant gives you a chance to find more problems in your design.
Based on his 1993 data, averaged from 11 usability tests and heuristic reviews, Nielsen figured that a single participant has about a 31% chance of finding a problem. (Note that the first participant crosses the 31% "Usability Problems Found" point. I marked the spot.)
But, his chart shows you a point of diminishing returns. He suggests "5 users" finds about 85% of the problems. Well, that sounds good. But is it true today?
Remember: the word "Ass/u/me" makes an "A__ of U and Me"
Here's where Jeff Sauro brings us forward a couple light years with his March 8, 2010 article "Why you only need to test with five users (explained)" First, he asks if Nielsen's 1993 findings apply to our more challenging commercial web world of 2010.
1) Nielsen uses an assumption which may be unrealistic for most, if not all, Web-sites. He assumes that any one test participant (or end-user) has a 31% chance of finding a problem.
2) Large-scale web sites (and applications) with many functions could have problems that have only a 10% chance of being found. (This is only one-third of the problem discovery potential given by Nielsen.)
3) If you have thousands of users, or if your application is critical (life-and-death, or high-financial impact, etc.) then you should very much be concerned with lower-frequency problems. Problems that occur even one percent of the time will bring frustration to 1,000 people if you have 100,000 users.
4) Last, Nielsen's approach does not apply to comparing web sites or to determining task completion rates. It does apply to discovering problems with an interface. We need to stick to that topic in our test results report.
Talking the talk with usability test results
Here's where Jeff's discussions with his buddy James Lewis (himself a prolific writer on usability topics) pay off for us all. The following comes from Jeff's website article I mentioned.
1. What Problem Occurrence Rate do you want to handle? Early in your design work, it's OK to figure that there are problems that are easy to discover. So easy, in fact, that any one test participant has, say, a 31% chance of finding any one of them.
We'll use the 31% chance of finding a problem largely because Nielsen's chart (presented above) uses that number and you are familiar with its claims – namely that 5 participants will uncover 85% of those types of problems.
But, before we go further, let's be clear on how to say this. This is a key point of your communication with your colleagues.
We want to say "We are testing for problems that have a 31% or greater chance of being experienced by a single end-user."
Another way of saying the same thing: "We are testing for problems that can affect 31% or more of our end-users".
Meanwhile, remember the limitations of this statement. It means we are not finding problems that are harder to find. We are not finding problems that affect fewer than 31% of our end-users.
Let's be concrete about using the 31% chance of "problem occurrence".
For every 1,000 end-users, it means you are not set up to find problems that could affect less than 31% of those people. 310 people is 31% of one thousand. Less than 31% is 309 people or fewer.
Are you happy with letting those 309 people experiencing a problem on your web site or application? That is the question.
Jeff Sauro indicates that a web-site or application with thousands of users may have a rate of problem occurrence below 10%. Would you like to know how many test participants you need to find those kinds of problems?
Probably yes. So, we'll tell you the answer below. Meanwhile, we have another issue to cover first: how likely are you to actually find those problems?
2. How serious are you about finding those problems? Jakob Nielsen's article and chart tells us how likely you are to actually find those problems.
Check out Nielsen's statement: "After the first study with 5 users has found 85% of the usability problems, you will want to fix these problems in a redesign." The number, 85%, here means the "chance" or "likelihood" you will find those problems that 31% percent of your end-users would experience.
Are you happy with an 85% chance of finding those problems? Maybe yes, if you're in a hurry, and world peace or financial survival does not depend on your website.
In fact, Jacob Nielsen also disagrees with the 85% chance of finding those problems. Read further into his article, and you'll see that he advocates using several sets of 5 test participants (iterative testing).
He recommends that you test with 5, make improvements, and then test with another 5 participants. Note that with 10 participants, you now have a 98% chance of finding those problems. Pretty good. And with another set of 5 participants, you have raised your chances to near certainty of finding those problems (99.6% in fact).
So – realize that even Jacob Nielsen advocated more than 5 participants for testing. He recommended 15! (Do we dare tell others?)
3. Getting serious about what problems we want to find. I promised to return to an important topic. The question was – how happy are you with finding problems that are sufficiently popular that at least 31% of your end-users would find them?
The answer was probably "no", you are not happy with finding just the "popular" problems. 31% is a pretty big number. It means you are only looking for problems that have about a 1 in 3 or greater chance of popping up. Yes, we want to find these. But, what else do we want to find?
What about problems that have only a 10% chance of being found? They may not be real easy to find, but they remain potent in discouraging repeat visits to those 10% of your site visitors.
Jeff adds a chart to his article that gives an idea of the game-change with this new insight.
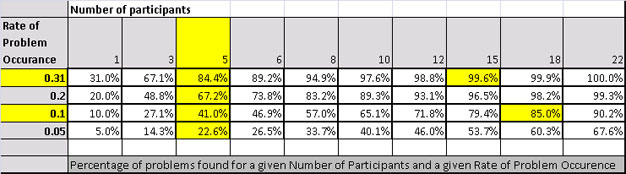
To help make this clear, I created a table using the formula Jeff and Nielsen used. Notice the column that shows "5" participants. You will see 84.4% in the row that shows the .31 Rate of Problem Occurrence.
This is the "85%" that Jakob Nielsen promised to find with five test participants. Notice that 10 participants lets you find 97.6% of the problems.
But, we figured that we also want to find the less popular problems – perhaps even problems with only a 10% chance of occurring.
This means that 10% of your users would experience those problems. If we want to find those problems, then 5 participants gives us only a 41% chance of finding them. To get an 85% chance of find those problems, then we need 18 participants.
Question: will this make sense to your management?
If you make your pitch in the right way, it should make sense.
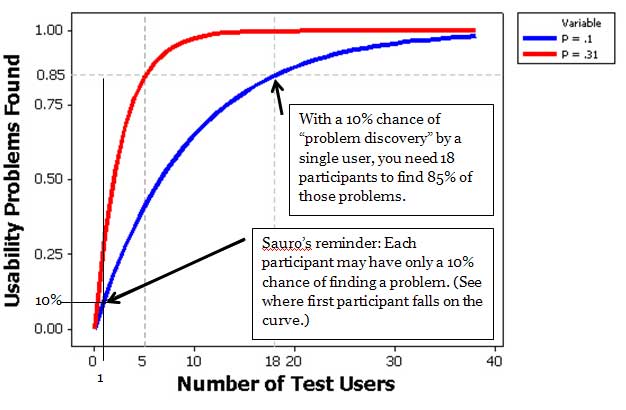
Figure: Difference in sample sizes needed to have an 85% chance of detecting a problem that affects 10% of users vs. 31% of users. You would need to plan on testing 18 users to have an 85% chance of detecting problems that affect 10% of users. (From Jeff Sauro’s article.)
Practice makes perfect
Congratulations. You made it to the end of this rather long article. I'll give you a few phrases to help you get the hang of how to talk the talk on usability testing.
1. Avoid talking about "success rates". We end up having to add comments about "confidence intervals" and "margins of errors" which gum up the conversation. Remember, you won't get elected president if you are too intelligent.
2. Instead, talk about the probability of "problem occurrence". Start with the simplest statement possible. You could even ask your management and colleagues something like "what portion of our audience can we allow to experience a problem?"
(Remember, if you are looking for problems that have a 31% chance or more of being found, then you are not looking for problems with less chance of being found. This means if 31% or more of your end-users could experience the problem, you have ignored problems that could be experienced by fewer than 31% of your end-users.)
Discuss the answers. If you have usability test data, read Jeff's article and check out his calculator that lets you see what your rate of problem occurrence has been so far.
3. Wow. To ask these questions takes courage – not just intelligence. It turns out you are addressing the topic of "risk mitigation". (Remember that phrase from the beginning of this article?) All business activity has its risks. Now we are asking "what is your tolerance for risk exposure?" It's that simple.
4. Also, with your management you'll need to discuss "what kind of risk".
Discussing "kinds of risk" takes you back to your regular usability concepts of problem "severity". Categorize your problems into something like "task failure" (Severe), "task challenges" (Difficult but Doable), and "task irritations" (Glitch but Doable).
Then assign what percent of your users you are willing to let experience each type of problem. Note that some research says there is no relationship between problem severity and problem frequency. So until we learn more about this, keep each type of problem as a separate analysis.
Identify each type of problem as you analyze your testing results. For example, are you willing to let 10% of your end-users experience "task failure" (a "severe problem")? If not, pick a more stringent target (say, 5%) and select the number of subjects necessary to evaluate that alternative rate of problem occurrence.
If your results show "no severe problems" with those participants, then you know you passed your own "risk mitigation criterion".
5. Along with with point number 2, you also have to select a target for "percent of problems found". In our Jakob Nielsen example, Nielsen was satisfied to find 85% of the problems.
Is your team satisfied to find only 85% of the "severe" problems that cause task failure in the open-heart surgery software that you're creating? Probably not. (OK, this is an extreme case. But you get the point.)
The table I gave you above lets you pick a comfortable "percent of problems found" in relation to the number of participants and the rate of problem occurrence. Jeff's website gives details on calculating the table I showed you.
Your team may be comfortable with finding only 85% of problems during the early phases of your design work. On the other hand, prior to final release into production with 5,000 customer-service reps, you may want to show that you found 99% of the problems you set out to find.
Recap, summary, review, shorter is better...
So you have it. Once again, with vigor...
1) What rate of problem occurrence do we want to tackle? (A 31% chance of finding a problem for a single participant also means that 31% or more of our end-users could experience the problem. Before final release, would you prefer to tackle problems that affect as few as 10% of end-users, or even 5% of end-users?)
2) Consider a different rate of problem occurrence for each of the levels of severity we define, given the cost of subjects, and penalties of failing to find the problem.
3) Given our commitments to #1 and #2, what percentage of those problems do we really want to find? 85%, 95%, 99%?
4) Figure out how many participants we need. Use my table or Jeff's calculations.
5) Remember iterative design and testing. We can distribute 15 participants across 3 test events. However, this assumes no drastic change in tasks or types of users across iterations.
References
Sauro, Jeff, 2010. Why you only need to test with five users (explained). www.measuringusability.com, 8 March, 2010.
Nielsen, Jakob, and Landauer, Thomas K.: "A mathematical model of the finding of usability problems," Proceedings of ACM INTERCHI'93 Conference (Amsterdam, The Netherlands, 24-29 April 1993), pp. 206-213.
Simonton, D. K. (1999a). Origins of genius: Darwinian perspectives on creativity. Oxford: Oxford University Press.
Turner, Carl W, Lewis, James R, Nielsen, J., 2006. "Determining Usability Test Sample Size," International Encyclopedia of Ergonomics and Human Factors. 2nd Edition, Vol 3. (Edited by Waldemar Karwowski, CRC Press, Boca Raton, FL)
Message from the CEO, Dr. Eric Schaffer — The Pragmatic Ergonomist

Good grief! This is SUCH an important point.
I recently was working on a banking system and found major investments being made based on surveys. When we dug deeper it seemed like EVERYTHING changed.
Everyone SAYS they want to improve their money management (they also SAY they want to exercise more). That does not mean it will happen. Every business person wants to know more about how to manage their finances, but that does not mean they will actually read through a library.
Huge investments get made because we think we can just take a survey at face value. Or because we word a question improperly. Without proper user research we fail at user-centered design.
Leave a comment here
Reader comments
Ed Schlotzhauer
Agilent Technologies
Thank you. I really appreciate help in communicating these difficult concepts to the decision makers. I like this approach. I have a question about the analysis of Nielsen's paper. It seems that it does not take into account the iterative nature of the process Mr. Nielsen proposes. If you test with a small group and then fix the problems before retesting, then each test is with a different error population. I have used a process somewhat like this successfully. It seems that as you get rid of the "big" problems, then subsequent test groups can see problems that were not as obvious before. I have not attempted to do a statistical analysis, but I have been happy with the results. I have assumed, based on observation that each round catches around 80% of the remaining defects. Am I just kidding myself?
Bijoy Krishnan M
InApp
It is good to see a detailed article on Usability Testing, which is less talked about in not so big companies as it is too expensive sometimes. Adding on I also think the experience of a tester has a relation with the test results. Would an experience tester find more errors? Sometimes it is not always true as an inexperienced tester may not follow a pattern and can find more errors. So it is uncertain. Then how do you check the tester's efficiency?
Ayush Jain
Cheese Corporate Care
Thanks John, for this highly informative article. It is truly essential to decide the number of users we test for on the basis of the tolerance in the error we can make. Another approach that can also be followed for usability testing is to first identify a few tasks for which the tolerance level for any error is very low. Probably, testing 18 users for only these important tasks would lead to clarity on any problems in the workflow of these particular tasks. The rest of the tasks which have more tolerance can probably be tested with fewer users to identify immediate problems only. This works in quite a few cases where only a few strong workflows exist. The challenge here, though, is to identify these correctly.
Ritch Macefield, Shannon-Weaver Ltd.
This is reasonably good but, like many articles on this subject, overlooks some very important points. I respectfully suggest readers check out my JUS paper: "MACEFIELD, R. C. P. (2009). How to specify the participant group size for usability studies. In Journal of Usability Studies, 5(1), pp. 34-45.
Subscribe
Sign up to get our Newsletter delivered straight to your inbox
Privacy policy
Reviewed: 18 Mar 2014
This Privacy Policy governs the manner in which Human Factors International, Inc., an Iowa corporation (“HFI”) collects, uses, maintains and discloses information collected from users (each, a “User”) of its humanfactors.com website and any derivative or affiliated websites on which this Privacy Policy is posted (collectively, the “Website”). HFI reserves the right, at its discretion, to change, modify, add or remove portions of this Privacy Policy at any time by posting such changes to this page. You understand that you have the affirmative obligation to check this Privacy Policy periodically for changes, and you hereby agree to periodically review this Privacy Policy for such changes. The continued use of the Website following the posting of changes to this Privacy Policy constitutes an acceptance of those changes.
Cookies
HFI may use “cookies” or “web beacons” to track how Users use the Website. A cookie is a piece of software that a web server can store on Users’ PCs and use to identify Users should they visit the Website again. Users may adjust their web browser software if they do not wish to accept cookies. To withdraw your consent after accepting a cookie, delete the cookie from your computer.
Privacy
HFI believes that every User should know how it utilizes the information collected from Users. The Website is not directed at children under 13 years of age, and HFI does not knowingly collect personally identifiable information from children under 13 years of age online. Please note that the Website may contain links to other websites. These linked sites may not be operated or controlled by HFI. HFI is not responsible for the privacy practices of these or any other websites, and you access these websites entirely at your own risk. HFI recommends that you review the privacy practices of any other websites that you choose to visit.
HFI is based, and this website is hosted, in the United States of America. If User is from the European Union or other regions of the world with laws governing data collection and use that may differ from U.S. law and User is registering an account on the Website, visiting the Website, purchasing products or services from HFI or the Website, or otherwise using the Website, please note that any personally identifiable information that User provides to HFI will be transferred to the United States. Any such personally identifiable information provided will be processed and stored in the United States by HFI or a service provider acting on its behalf. By providing your personally identifiable information, User hereby specifically and expressly consents to such transfer and processing and the uses and disclosures set forth herein.
In the course of its business, HFI may perform expert reviews, usability testing, and other consulting work where personal privacy is a concern. HFI believes in the importance of protecting personal information, and may use measures to provide this protection, including, but not limited to, using consent forms for participants or “dummy” test data.
The Information HFI Collects
Users browsing the Website without registering an account or affirmatively providing personally identifiable information to HFI do so anonymously. Otherwise, HFI may collect personally identifiable information from Users in a variety of ways. Personally identifiable information may include, without limitation, (i)contact data (such as a User’s name, mailing and e-mail addresses, and phone number); (ii)demographic data (such as a User’s zip code, age and income); (iii) financial information collected to process purchases made from HFI via the Website or otherwise (such as credit card, debit card or other payment information); (iv) other information requested during the account registration process; and (v) other information requested by our service vendors in order to provide their services. If a User communicates with HFI by e-mail or otherwise, posts messages to any forums, completes online forms, surveys or entries or otherwise interacts with or uses the features on the Website, any information provided in such communications may be collected by HFI. HFI may also collect information about how Users use the Website, for example, by tracking the number of unique views received by the pages of the Website, or the domains and IP addresses from which Users originate. While not all of the information that HFI collects from Users is personally identifiable, it may be associated with personally identifiable information that Users provide HFI through the Website or otherwise. HFI may provide ways that the User can opt out of receiving certain information from HFI. If the User opts out of certain services, User information may still be collected for those services to which the User elects to subscribe. For those elected services, this Privacy Policy will apply.
How HFI Uses Information
HFI may use personally identifiable information collected through the Website for the specific purposes for which the information was collected, to process purchases and sales of products or services offered via the Website if any, to contact Users regarding products and services offered by HFI, its parent, subsidiary and other related companies in order to otherwise to enhance Users’ experience with HFI. HFI may also use information collected through the Website for research regarding the effectiveness of the Website and the business planning, marketing, advertising and sales efforts of HFI. HFI does not sell any User information under any circumstances.
Disclosure of Information
HFI may disclose personally identifiable information collected from Users to its parent, subsidiary and other related companies to use the information for the purposes outlined above, as necessary to provide the services offered by HFI and to provide the Website itself, and for the specific purposes for which the information was collected. HFI may disclose personally identifiable information at the request of law enforcement or governmental agencies or in response to subpoenas, court orders or other legal process, to establish, protect or exercise HFI’s legal or other rights or to defend against a legal claim or as otherwise required or allowed by law. HFI may disclose personally identifiable information in order to protect the rights, property or safety of a User or any other person. HFI may disclose personally identifiable information to investigate or prevent a violation by User of any contractual or other relationship with HFI or the perpetration of any illegal or harmful activity. HFI may also disclose aggregate, anonymous data based on information collected from Users to investors and potential partners. Finally, HFI may disclose or transfer personally identifiable information collected from Users in connection with or in contemplation of a sale of its assets or business or a merger, consolidation or other reorganization of its business.
Personal Information as Provided by User
If a User includes such User’s personally identifiable information as part of the User posting to the Website, such information may be made available to any parties using the Website. HFI does not edit or otherwise remove such information from User information before it is posted on the Website. If a User does not wish to have such User’s personally identifiable information made available in this manner, such User must remove any such information before posting. HFI is not liable for any damages caused or incurred due to personally identifiable information made available in the foregoing manners. For example, a User posts on an HFI-administered forum would be considered Personal Information as provided by User and subject to the terms of this section.
Security of Information
Information about Users that is maintained on HFI’s systems or those of its service providers is protected using industry standard security measures. However, no security measures are perfect or impenetrable, and HFI cannot guarantee that the information submitted to, maintained on or transmitted from its systems will be completely secure. HFI is not responsible for the circumvention of any privacy settings or security measures relating to the Website by any Users or third parties.
Correcting, Updating, Accessing or Removing Personal Information
If a User’s personally identifiable information changes, or if a User no longer desires to receive non-account specific information from HFI, HFI will endeavor to provide a way to correct, update and/or remove that User’s previously-provided personal data. This can be done by emailing a request to HFI at hfi@humanfactors.com. Additionally, you may request access to the personally identifiable information as collected by HFI by sending a request to HFI as set forth above. Please note that in certain circumstances, HFI may not be able to completely remove a User’s information from its systems. For example, HFI may retain a User’s personal information for legitimate business purposes, if it may be necessary to prevent fraud or future abuse, for account recovery purposes, if required by law or as retained in HFI’s data backup systems or cached or archived pages. All retained personally identifiable information will continue to be subject to the terms of the Privacy Policy to which the User has previously agreed.
Contacting HFI
If you have any questions or comments about this Privacy Policy, you may contact HFI via any of the following methods:
Human Factors International, Inc.
PO Box 2020
1680 highway 1, STE 3600
Fairfield IA 52556
hfi@humanfactors.com
(800) 242-4480
Terms and Conditions for Public Training Courses
Reviewed: 18 Mar 2014
Cancellation of Course by HFI
HFI reserves the right to cancel any course up to 14 (fourteen) days prior to the first day of the course. Registrants will be promptly notified and will receive a full refund or be transferred to the equivalent class of their choice within a 12-month period. HFI is not responsible for travel expenses or any costs that may be incurred as a result of cancellations.
Cancellation of Course by Participants (All regions except India)
$100 processing fee if cancelling within two weeks of course start date.
Cancellation / Transfer by Participants (India)
4 Pack + Exam registration: Rs. 10,000 per participant processing fee (to be paid by the participant) if cancelling or transferring the course (4 Pack-CUA/CXA) registration before three weeks from the course start date. No refund or carry forward of the course fees if cancelling or transferring the course registration within three weeks before the course start date.
Cancellation / Transfer by Participants (Online Courses)
$100 processing fee if cancelling within two weeks of course start date. No cancellations or refunds less than two weeks prior to the first course start date.
Individual Modules: Rs. 3,000 per participant ‘per module’ processing fee (to be paid by the participant) if cancelling or transferring the course (any Individual HFI course) registration before three weeks from the course start date. No refund or carry forward of the course fees if cancelling or transferring the course registration within three weeks before the course start date.
Exam: Rs. 3,000 per participant processing fee (to be paid by the participant) if cancelling or transferring the pre agreed CUA/CXA exam date before three weeks from the examination date. No refund or carry forward of the exam fees if requesting/cancelling or transferring the CUA/CXA exam within three weeks before the examination date.
No Recording Permitted
There will be no audio or video recording allowed in class. Students who have any disability that might affect their performance in this class are encouraged to speak with the instructor at the beginning of the class.
Course Materials Copyright
The course and training materials and all other handouts provided by HFI during the course are published, copyrighted works proprietary and owned exclusively by HFI. The course participant does not acquire title nor ownership rights in any of these materials. Further the course participant agrees not to reproduce, modify, and/or convert to electronic format (i.e., softcopy) any of the materials received from or provided by HFI. The materials provided in the class are for the sole use of the class participant. HFI does not provide the materials in electronic format to the participants in public or onsite courses.