- About us
- Contact us: +1.641.472.4480, hfi@humanfactors.com
Cool stuff and UX resources
Improving usability
Theresa LePore, the supervisor of elections in Palm Beach County Florida, has received much criticism for the ballot she designed for this year's presidential election. Actually she made several good decisions. For example, she attempted to improve the ballot for older voters by making the characters larger. Also, she wanted to have all presidential candidates on one page. Her solution was to use what has become known as the "butterfly ballot."
Actually, to ensure adequate reading performance, she should have focused on at least five issues:
- font size,
- font type,
- text versus background color,
- the light level where the voting occurred, and
- the overall layout of the ballot.
Font size – For the majority of voters, a font size of 10 points would have been satisfactory. Most books are printed using type that is 10 or 11 points (a "point" is 1/72 of an inch). To accommodate older users, however, the research suggests that the characters should have been at least 12 points (maybe even 14 points). It is acceptable to use smaller fonts sizes when users can move closer to the text (or move the text closer to them) in order to make the image in the eye (angle subtended on the retina) larger.
Using all uppercase letters, which she elected to do, made the characters slightly larger for users. The most recent research on using uppercase versus lowercase letters for names shows clearly that there is no reliable difference between them in reading performance.
Font type – She used a "sans serif" font for the names. This decision was acceptable. There is one study that suggests that people over age 60 read "serif" fonts faster than sans serif fonts. In this case, the speed of reading is not as important as the accuracy of reading. Florida law allows each voter five minutes in the voting booth.
Text vs. background – The fastest and most accurate readability comes from using black text on a white background. This is what she did. The ballot appears to be black print on "white" card stock.
Illumination level – We do not know about the illumination level where the votes were cast. One recent research study found that in 71% of over 50 different "public places" in Florida, the light level was too low for adequate reading. Older adults need more illumination in order to see well.
In general, because the main usability issue was reading accurately, not reading quickly, Ms. LePore did an adequate job of dealing with these basic human factors issues.
Layout of the ballot
The issues surrounding the layout of the ballot are much more difficult to deal with, and are not nearly as easy to detect and resolve. It is difficult, even for usability experts, to identify some types of layout and formatting problems. For this reason, usability professionals make considerable use of usability tests.
Usability testing – Usability tests are intended to identify and correct problems before products are used by large numbers of users. In Ms. LePore's case, she would be interested in finding and fixing most of the serious problems voters would have on Election Day. In her case, a usability test would require several people pretending to vote while using the proposed ballot. While voting, these test participants would be observed by experienced usability testers. The testers would note and record any difficulties that the "voters" appeared to be having.
After voting, the participants would be individually interviewed about any concerns they had or any problems they may have experienced. This information would be used to change the ballot, and then a second round of usability testing would take place. Sometimes it takes three to five (or more) iterations (design, test, redesign) to achieve the desired outcome, i.e., to meet the performance goals for the ballot.
The Buchanan problem
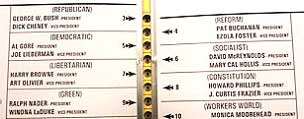
Pat Buchanan got 3,411 machine-counted votes for president in this heavily Democratic county (62% voted for Al Gore and 35% voted for George Bush). The number of votes for Buchanan was higher than he received in any other Florida county. One explanation for the large number of votes related to the way Palm Beach County's punch-card style ballot was laid out for the presidential race. Candidates were listed on both sides of the front page in a vertical row of holes where the voters punched their choices. The top hole was for Bush, listed at top left; the second hole was for Buchanan, listed at top right, and the third hole was for Gore, listed under Bush on the left. The layout is shown below.
Informal evaluations – Theresa LePore designed the ballot and then had it reviewed. Her usability testing, however, was limited in its scope. It initially consisted of seeking approval by two other members of the canvassing board of which she was a member. These two evaluators were intelligent, and highly experienced in conducting elections – one was a county commissioner (Carol Roberts) and the other was a judge (Charles Burton). Even so, the probability of one or the other of these two people detecting the "Buchanan" problem by simply looking at the ballot was very low. I calculated it as being about two chances in 100.
Ms. LePore then sent the ballot to both the Democratic and Republican National Committees for review. If we assume that the two groups had a total of ten people look at the ballot, the probability that one or more people in this group would have found the "Buchanan" problem was also low. I calculated that they had about one chance in ten of finding the problem. Obviously, none of these reviewers identified the "Buchanan" problem.
Number of test participants
Ms. LePore was not familiar with usability testing, but neither are many other highly experienced designers. For example, shortly after the Florida voting issue became known, one highly experienced system developer wrote: "Would usability testing (which often only uses 5-20 people of each background) have caught it? I think so." He links users to Jakob Nielsen's Web site, where Nielsen has suggested that "100% of usability problems can be found using only 15 subjects." Neither is correct in their estimates of the number of test subjects needed.
How many usability test participants would have been required for Ms. LePore to feel confident of finding these types of problems?
This answer can be calculated.* If the voters in Palm Beach county voted for Buchanan at the same rate as those in the other Florida counties, Buchanan would have received around 600 votes, instead of 3,407. Many have proposed that this suggests that about 2,800 votes (3,400 minus 600) were erroneously made. We do not know for sure – the votes may have been correctly made for Buchanan. Keep in mind that Buchanan received over 8,000 votes in Palm Beach County in the 1996 presidential primary when he was running against Bob Dole.
For our purposes, we will assume that the "Buchanan" problem was only a difficulty for about 1% of all the voters (2,800 "erroneous" votes divided by the 269,951 actual and potential Gore voters). My calculations show that Ms. LePore would have required 289 test participants to find 95% of the problems, which most likely would have led to detection of the "Buchanan" problem before the election. Over four-hundred (423) Democratic test participants would have been required to find 99% of the problems.
What most of Ms. LePore's critics are ignoring is that more than 99% of the voters had no trouble voting when using Ms. LePore's ballot. They obviously intended to vote for Mr. Gore and actually did vote for him. Of significant interest to us is what was different about the 1% of people who had problems? Taken further, what could be done to change the ballot so that virtually everyone voted without problems?
There are several possibilities about those that had problems:
- Were they using ballots that had been printed differently?
- Were they much older or much younger?
- Were they more or less intelligent?
- Were they more or less educated?
- Were they first-time or long-time voters?
- Were they much taller or much shorter?
- Did they forget their glasses?
- Did they have trouble reading English?
- Did they vote early in the day or late?
- Did they vote when they were "fresh" or when they were very tired?
- Did they have difficulty following instructions?
- Did they receive no help or instructions, or special instructions from the voting staff?
- Did they have accessibility problems (low vision, movement control, etc.)?
- Did they have a condition that would hamper their voting, such as Parkinson's disease?
- Were they taking a prescriptive (or illegal) drug that affected their concentration?
- Were they very nervous (did they have high anxiety)?
- Were they motivated just to vote, not to vote correctly?
A good usability tester would have tried to determine which of the above reasons (and possibly others) most affected the voters. Where possible, the ballot would have been changed to better accommodate the users that had problems.
The "multiple votes" problem
The same reasoning and calculations can be used with the other major problem of multiple votes. In Palm Beach County there were 19,020 other ballots that were not considered valid (they were disqualified) because the voters had voted (punched) for more than one presidential candidate. In the official results, there were 432,286 ballots completed in Palm Beach county. This means that 4.4% of the ballots were considered invalid (19,020/432,286).
The question is how many test participants would have been required to have almost certainly detected the problem? The same formula can be applied. I calculate that they would have required 65 participants to complete a sample ballot, in order to find 95% of the problems (94 subjects to detect 99% of problems). This is far fewer than were required for the "Buchanan" problem because a higher percentage of voters actually ended up making the "multiple votes" error.
The "dimpled ballot" problem
Even the highly publicized "dimpled ballot" problem could have been identified before the election.
Palm Beach county had the initial machine count on November 7, then a machine recount on November 8, and then the absentee ballots were added. They then manually counted all 432,286 ballots cast. After the manual recount, Gore had gained about 215 more votes then did Bush. The manual recount was complicated by about 3,300 ballots that did not have clear punches for either candidate. These included those that were mispunched (hole in the wrong place), partially punched (the chad was still hanging), pin-hole punched (some light could be seen through the hole), some that were almost punched (dimpled), etc. Each of these ballots were closely reviewed by the three-member canvassing board.
Would it have been possible to have done a usability test that would have identified these punched-card variations before the election? It would have required highly experienced usability testers. They would have required truly representative test participants, the actual ballots (not samples), some of the actual Votomatic punchcard machines and styluses, and test items that were truly representative of the voting experience (including the ability to not vote for certain candidates). The number of subjects needed to detect 95% of the errors would have been 115, and to detect 99% would have been 166.
Problems associated with using the punchcard machines have been known for many years. Many changes have been made to the machines to reduce these problems. In addition a set of instructions on how to vote is provided on (a) the sample ballots, (b) the actual ballots and (c) the walls of the voting booth itself in large letters . The instructions say:
"STEP 3 – To vote, hold the voting instrument straight up. Punch straight down through the ballot card for the candidates of your choice." (The bolding was on the voter's instructions in the ballot.)
One final point should be made. To help shift some of the responsibility for having each voter's ballot counted to the voter, a final instruction in all capital letters, is shown at the bottom of the "instructions" page:
"AFTER VOTING, CHECK YOUR BALLOT CARD TO BE SURE YOUR VOTING SELECTIONS ARE CLEARLY AND CLEANLY PUNCHED AND THERE ARE NO CHIPS LEFT HANGING ON THE BACK OF THE CARD."
Conclusion
My conclusion is that Theresa LePore should not be so severely criticized for making design decisions that led to the "Buchanan" and "Multiple votes" problems. In the past, few (if any) ballots (and their related instructions) have received the kind of rigorous usability testing that would have identified these problems before the actual election. Having a certain number of voter problems, and uncounted votes, has been more or less considered an acceptable part of holding elections with millions of voters. For elections that were not too close, the traditional ways of casting and counting votes has been "good enough."
Generally, usability testing has been considered too expensive. I figure that it would have cost about $20,000 to run the necessary performance tests on LePore's Palm Beach ballot. These usability tests would have enabled ballot designers to find and rectify the "Buchanan" problem, the "Multiple votes" problem, and maybe even the "dimpled ballot" problem. The two presidential candidates spent about one billion dollars trying to get elected.
Footnote
*Calculation of required number of test participants:
A reasonable estimate of the number of participants required to detect the problem can be made by using the formula: 1-(1-p)n, where p = the probability of the usability problem occurring, and n = the number of test participants required.
Calculating the Number of Test Subjects
Introduction
Many people have requested an explanation on how to use the binomial probability formula used for calculating the number of subjects needed. Hopefully, the following information will help in clarifying the major issues.
The original reference for the formula, as it relates to usability testing, goes back to Bob Virzi at GTE in 1990. Virzi's article was followed by one from Jim Lewis at IBM in 1993, and another one by Lewis in 1994. Many statistics books contain the formula for calculating a binomial probability, but these two sources have usability-related examples. I have taken their original write-ups and added new information plus some examples in the third edition of my Human Performance Engineering textbook (pp. 210-215).
The actual formula is 1-(1-p)n, where p is the probability of the usability problem occurring, and n is the number of test participants required. Based on the Palm Beach county voting returns, we know that "p" is 0.01, and we are interested in finding out "n." In other words, we are trying to find a problem that is only a difficulty for one out of 100 people ("p"), and we want to estimate the number of subjects necessary to feel confident that we can find this problem (or problems).
Generally, we apply this formula to determine the minimum number of test subjects needed to find a certain percentage of the usability problems in a system or in a Web site. Unfortunately, we never know how many usability problems actually exist in a new system, and we do not know what percent of the actual problems each test subject (or heuristic evaluator) will help us find. Virzi originally proposed that it was .40 (Virzi, 1990) and Nielsen has been advocating .31 (Alertbox: March 19, 2000).
The major problem with either the .40 or the .31, or any similar numbers, is that they represent the proportion of usability problems found by one evaluator (or one test subject) over the total found by all evaluators (or all test subjects). The number of usability problems found by all evaluators is not the actual number of usability problems in a system (see Bailey, et.al., 1992). The evaluators will miss finding or experiencing certain problems, and they will think that a relatively large number of issues are usability problems when they are not problems. We usually refer to these latter problems as "false alarms" (Catani and Biers, 1998; Stanton and Stevenage, 1998; Rooden, et.al., 1999). Based on the studies just referenced, there can be as many as two false alarms for every true problem.
Lewis at IBM (1994) reported on a study where his participants were test subjects. They used a system where he had created numerous usability problems ("salted the mine"). They experienced a combined total of 145 problems. He calculated that the average likelihood of any one subject experiencing a problem was .16 (obviously this is far less than .40 or .31).
If a system truly contained 145 usability problems, and if each person experienced only about 16% of all the problems, and if we had five participants, we could use the formula to calculate what percent of the problems all five subjects would be expected to uncover.
1-(1-.16)5 = 1-(.84)5 = 1-.42 = .58
Using the five test subjects, we would expect to find about 58% of the problems. If we used ten test subjects, what percent of the 145 problems would we expect them to uncover?
1-(1-.16)10 = 1-(.84)10 = 1-.17 = .83
Using the ten test subjects, we would expect to find about 83% of the usability problems. To put it another way, we would expect to find and (hopefully) fix those problems that could pose some difficulty to about four out of five users. The major assumption here is that each subject will, on average, experience about 16% of the problems.
Usability professionals try to use the appropriate number of subjects that will enable them to accomplish the goals of a usability test as efficiently as possible. If we use too many, we can increase the cost and development time of a system. If we use too few, we may fail to detect some serious problems, and could reduce the overall usability of the product. When designing Palm Beach county's ballot, Ms. LePore used far too few.
The Buchanan (butterfly ballot) problem provided a unique experience for usability professionals. It provided us with one of the numbers we usually do not have - The actual (true) proportion of people who had difficulty voting because of one or more usability problems related to the ballot. There were 2,800 "erroneous" votes made by 272,532 actual and potential Gore voters. This was about one out of 100 or 0.01. In other words, 99% of the users (voters) dealt effectively with the ballot's usability-related problems, but 1% did not.
The question then becomes, how many test subjects would have been needed to find (identify) the usability problems that posed difficulties to this relatively small number (1%) of users? Most usability testers never worry about these problems because the cost (in terms of the time needed to conduct the tests, and the large number of test subjects needed) for finding these difficulties is too great for most systems. Obviously, if the penalty for making errors was serious injury, loss of life, huge "support" costs, losing millions of dollars in sales, or a lost presidential election, then it may be worth the money to find and fix the problems.
I applied the binomial probability formula to estimate the number of usability test subjects Ms. LePore would have needed. In this case, "p" is .01, which is the probability of the usability problem occurring. Without building a special program to solve for "n," we simply increased "n" in the formula until we found the number of subjects needed to find either 95% or 99% of the ballot problems using a usability test.
- Showing the ballot to two co-workers: 1-(1-.01)2 = 1-(.99)2 = 1-.98 = .02
- Showing the ballot to 10 people in the parties: 1-(1-.01)12 = 1-(.99)12 = 1-.89 = .11
- Using "Jakob's 15 subjects:" 1-(1-.01)15 = 1-(.99)15 = 1-.86 = .14
- Using 50 subjects: 1-(1-.01)50 = 1-(.99)50 = 1-.61 = .39
- Using 100 subjects: 1-(1-.01)100 = 1-(.99)100 = 1-.37 = .63
- Using 200 subjects: 1-(1-.01)200 = 1-(.99)200 = 1-.13 = .87
- Using 250 subjects: 1-(1-.01)250 = 1-(.99)250 = 1-.08 = .92
- Using 289 subjects: 1-(1-.01)289 = 1-(.99)289 = 1-.05 = .95
- Using 423 subjects: 1-(1-.01)423 = 1-(.99)423 = 1-.01 = .99
Another way of thinking about the problem is that if any one participant has a low probability of having difficulties with the ballot, which the actual numbers show, the total number of participants needed to find difficulties like the Buchanan (butterfly ballot) problem can become very high. In this case, 289 subjects would be needed to find 95% of those problems that are only difficulties to a very small number (1%) of voters. Four hundred and twenty-three would be needed to find 99%.
References
Bailey, R.W. (1996), Human Performance Engineering: Designing High Quality, Professional User Interfaces for Computer Products, Applications and Systems, Prentice Hall: Englewood Cliffs, NJ.
Bailey, R.W., Allen, R.W. and Raiello, P. (1992), Usability testing vs. heuristic evaluation: A head-to-head comparison, Proceedings of the Human Factors Society 36th Annual Meeting, 409-413.
Catani, M. B. and Biers, D. W. (1998), Usability evaluation and prototype fidelity: Users and usability professionals, Proceedings of the Human Factors and Ergonomics Society 42nd Annual Meeting, 1331-1335.
Lewis, J.R. (1994), Sample sizes for usability studies: Additional considerations, Human Factors, 36(2), 368-378.
Lewis, J.R. (1993), Problem discovery in usability studies: A model based on the binomial probability formula, Proceedings of the 5th International Conference on Human-Computer Interaction, 666-671.
Rooden, M.J., Green, W.S. and Kanis, H. (1999), Difficulties in usage of a coffeemaker predicted on the basis of design models, Proceedings of the Human Factors and Ergonomics Society - 1999, 476-480.
Stanton, N.A. and Stevenage, S.V. (1998), Learning to predict human error: Issues of acceptability, reliability and validity, Ergonomics, 41(11), 1737-1747.
Virzi, R.A. (1990), Streamlining the design process: Running fewer subjects, Proceedings of the Human Factors Society 34th Annual Meeting, 291-294.
Leave a comment here
Subscribe
Sign up to get our Newsletter delivered straight to your inbox
Privacy policy
Reviewed: 18 Mar 2014
This Privacy Policy governs the manner in which Human Factors International, Inc., an Iowa corporation (“HFI”) collects, uses, maintains and discloses information collected from users (each, a “User”) of its humanfactors.com website and any derivative or affiliated websites on which this Privacy Policy is posted (collectively, the “Website”). HFI reserves the right, at its discretion, to change, modify, add or remove portions of this Privacy Policy at any time by posting such changes to this page. You understand that you have the affirmative obligation to check this Privacy Policy periodically for changes, and you hereby agree to periodically review this Privacy Policy for such changes. The continued use of the Website following the posting of changes to this Privacy Policy constitutes an acceptance of those changes.
Cookies
HFI may use “cookies” or “web beacons” to track how Users use the Website. A cookie is a piece of software that a web server can store on Users’ PCs and use to identify Users should they visit the Website again. Users may adjust their web browser software if they do not wish to accept cookies. To withdraw your consent after accepting a cookie, delete the cookie from your computer.
Privacy
HFI believes that every User should know how it utilizes the information collected from Users. The Website is not directed at children under 13 years of age, and HFI does not knowingly collect personally identifiable information from children under 13 years of age online. Please note that the Website may contain links to other websites. These linked sites may not be operated or controlled by HFI. HFI is not responsible for the privacy practices of these or any other websites, and you access these websites entirely at your own risk. HFI recommends that you review the privacy practices of any other websites that you choose to visit.
HFI is based, and this website is hosted, in the United States of America. If User is from the European Union or other regions of the world with laws governing data collection and use that may differ from U.S. law and User is registering an account on the Website, visiting the Website, purchasing products or services from HFI or the Website, or otherwise using the Website, please note that any personally identifiable information that User provides to HFI will be transferred to the United States. Any such personally identifiable information provided will be processed and stored in the United States by HFI or a service provider acting on its behalf. By providing your personally identifiable information, User hereby specifically and expressly consents to such transfer and processing and the uses and disclosures set forth herein.
In the course of its business, HFI may perform expert reviews, usability testing, and other consulting work where personal privacy is a concern. HFI believes in the importance of protecting personal information, and may use measures to provide this protection, including, but not limited to, using consent forms for participants or “dummy” test data.
The Information HFI Collects
Users browsing the Website without registering an account or affirmatively providing personally identifiable information to HFI do so anonymously. Otherwise, HFI may collect personally identifiable information from Users in a variety of ways. Personally identifiable information may include, without limitation, (i)contact data (such as a User’s name, mailing and e-mail addresses, and phone number); (ii)demographic data (such as a User’s zip code, age and income); (iii) financial information collected to process purchases made from HFI via the Website or otherwise (such as credit card, debit card or other payment information); (iv) other information requested during the account registration process; and (v) other information requested by our service vendors in order to provide their services. If a User communicates with HFI by e-mail or otherwise, posts messages to any forums, completes online forms, surveys or entries or otherwise interacts with or uses the features on the Website, any information provided in such communications may be collected by HFI. HFI may also collect information about how Users use the Website, for example, by tracking the number of unique views received by the pages of the Website, or the domains and IP addresses from which Users originate. While not all of the information that HFI collects from Users is personally identifiable, it may be associated with personally identifiable information that Users provide HFI through the Website or otherwise. HFI may provide ways that the User can opt out of receiving certain information from HFI. If the User opts out of certain services, User information may still be collected for those services to which the User elects to subscribe. For those elected services, this Privacy Policy will apply.
How HFI Uses Information
HFI may use personally identifiable information collected through the Website for the specific purposes for which the information was collected, to process purchases and sales of products or services offered via the Website if any, to contact Users regarding products and services offered by HFI, its parent, subsidiary and other related companies in order to otherwise to enhance Users’ experience with HFI. HFI may also use information collected through the Website for research regarding the effectiveness of the Website and the business planning, marketing, advertising and sales efforts of HFI. HFI does not sell any User information under any circumstances.
Disclosure of Information
HFI may disclose personally identifiable information collected from Users to its parent, subsidiary and other related companies to use the information for the purposes outlined above, as necessary to provide the services offered by HFI and to provide the Website itself, and for the specific purposes for which the information was collected. HFI may disclose personally identifiable information at the request of law enforcement or governmental agencies or in response to subpoenas, court orders or other legal process, to establish, protect or exercise HFI’s legal or other rights or to defend against a legal claim or as otherwise required or allowed by law. HFI may disclose personally identifiable information in order to protect the rights, property or safety of a User or any other person. HFI may disclose personally identifiable information to investigate or prevent a violation by User of any contractual or other relationship with HFI or the perpetration of any illegal or harmful activity. HFI may also disclose aggregate, anonymous data based on information collected from Users to investors and potential partners. Finally, HFI may disclose or transfer personally identifiable information collected from Users in connection with or in contemplation of a sale of its assets or business or a merger, consolidation or other reorganization of its business.
Personal Information as Provided by User
If a User includes such User’s personally identifiable information as part of the User posting to the Website, such information may be made available to any parties using the Website. HFI does not edit or otherwise remove such information from User information before it is posted on the Website. If a User does not wish to have such User’s personally identifiable information made available in this manner, such User must remove any such information before posting. HFI is not liable for any damages caused or incurred due to personally identifiable information made available in the foregoing manners. For example, a User posts on an HFI-administered forum would be considered Personal Information as provided by User and subject to the terms of this section.
Security of Information
Information about Users that is maintained on HFI’s systems or those of its service providers is protected using industry standard security measures. However, no security measures are perfect or impenetrable, and HFI cannot guarantee that the information submitted to, maintained on or transmitted from its systems will be completely secure. HFI is not responsible for the circumvention of any privacy settings or security measures relating to the Website by any Users or third parties.
Correcting, Updating, Accessing or Removing Personal Information
If a User’s personally identifiable information changes, or if a User no longer desires to receive non-account specific information from HFI, HFI will endeavor to provide a way to correct, update and/or remove that User’s previously-provided personal data. This can be done by emailing a request to HFI at hfi@humanfactors.com. Additionally, you may request access to the personally identifiable information as collected by HFI by sending a request to HFI as set forth above. Please note that in certain circumstances, HFI may not be able to completely remove a User’s information from its systems. For example, HFI may retain a User’s personal information for legitimate business purposes, if it may be necessary to prevent fraud or future abuse, for account recovery purposes, if required by law or as retained in HFI’s data backup systems or cached or archived pages. All retained personally identifiable information will continue to be subject to the terms of the Privacy Policy to which the User has previously agreed.
Contacting HFI
If you have any questions or comments about this Privacy Policy, you may contact HFI via any of the following methods:
Human Factors International, Inc.
PO Box 2020
1680 highway 1, STE 3600
Fairfield IA 52556
hfi@humanfactors.com
(800) 242-4480
Terms and Conditions for Public Training Courses
Reviewed: 18 Mar 2014
Cancellation of Course by HFI
HFI reserves the right to cancel any course up to 14 (fourteen) days prior to the first day of the course. Registrants will be promptly notified and will receive a full refund or be transferred to the equivalent class of their choice within a 12-month period. HFI is not responsible for travel expenses or any costs that may be incurred as a result of cancellations.
Cancellation of Course by Participants (All regions except India)
$100 processing fee if cancelling within two weeks of course start date.
Cancellation / Transfer by Participants (India)
4 Pack + Exam registration: Rs. 10,000 per participant processing fee (to be paid by the participant) if cancelling or transferring the course (4 Pack-CUA/CXA) registration before three weeks from the course start date. No refund or carry forward of the course fees if cancelling or transferring the course registration within three weeks before the course start date.
Cancellation / Transfer by Participants (Online Courses)
$100 processing fee if cancelling within two weeks of course start date. No cancellations or refunds less than two weeks prior to the first course start date.
Individual Modules: Rs. 3,000 per participant ‘per module’ processing fee (to be paid by the participant) if cancelling or transferring the course (any Individual HFI course) registration before three weeks from the course start date. No refund or carry forward of the course fees if cancelling or transferring the course registration within three weeks before the course start date.
Exam: Rs. 3,000 per participant processing fee (to be paid by the participant) if cancelling or transferring the pre agreed CUA/CXA exam date before three weeks from the examination date. No refund or carry forward of the exam fees if requesting/cancelling or transferring the CUA/CXA exam within three weeks before the examination date.
No Recording Permitted
There will be no audio or video recording allowed in class. Students who have any disability that might affect their performance in this class are encouraged to speak with the instructor at the beginning of the class.
Course Materials Copyright
The course and training materials and all other handouts provided by HFI during the course are published, copyrighted works proprietary and owned exclusively by HFI. The course participant does not acquire title nor ownership rights in any of these materials. Further the course participant agrees not to reproduce, modify, and/or convert to electronic format (i.e., softcopy) any of the materials received from or provided by HFI. The materials provided in the class are for the sole use of the class participant. HFI does not provide the materials in electronic format to the participants in public or onsite courses.